|
SWMM Plotter
|   |
|
SWMM Plotter
| |
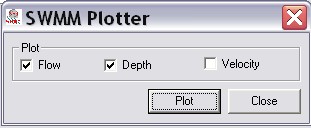
This function prepares time series hydrographs of flowrate, depth and velocity for all data that has been read in from a SWMM result file and has matching data in the Gages and GageData tables. Results are plotted in GIF files for each storm where the Plot field is checked in the Storms table, Plot is checked in the Gages table, and for each data type checked in the Plotter dialog.
The STORM field should not have any special characters. This field is used to create file names in addition to being used in compilation of gage statistics.
|
StormStart |
StormEnd |
DryPeriod |
Storm |
StormDepthInches |
Plot |
|
02/06/2008 7:00:00 PM |
02/07/2008 10:00:00 AM |
Yes |
Feb 6 |
0 |
Yes |
|
02/12/2008 9:00:00 PM |
02/13/2008 11:00:00 PM |
Yes |
Feb 12 |
0 |
Yes |
|
02/18/2008 |
02/18/2008 6:00:00 PM |
No |
Feb 18 |
0 |
No |
|
Gagenum |
Conduit |
Junction |
Station |
Offset |
Comment |
Interval |
Plot |
GraphHeader |
|
1 |
Pa47 |
a47 |
|
|
|
15 |
Yes |
Meter #1 48" in Main St |
|
2 |
Pb52 |
|
|
|
|
15 |
No |
Meter #2 36" in First St |
|
3 |
Pc34 |
c34 |
|
|
|
15 |
Yes |
Meter #3 54" in Broadway |
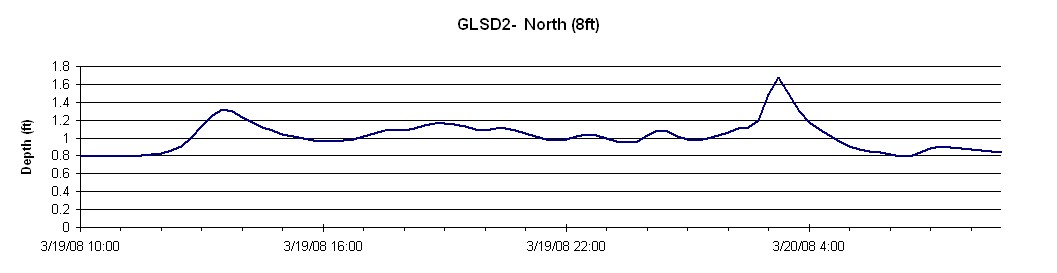
If Junction name is blank, the plot will report the Depth simulated in the conduit. Note that SWMM reports an average conduit depth, which may not be appropriate in some cases, and that conduit depth and junction depth may differ in a variety of circumstances.
|
gagenum |
DateTime |
inches |
ftpersec |
mgd |
|
NorthOutfall |
02/25/2008 9:15:00 AM |
25.927 |
0 |
0 |
|
NorthOutfall |
02/25/2008 9:30:00 AM |
25.927 |
0 |
0 |
|
PorterStreet |
11/29/2007 3:15:00 PM |
9.201 |
0 |
0 |
The user must first populate the Storms, Gages, and GageData tables using Access or comparable means.
Plotter uses gage summary statistics as last computed by the Compile Gage Statistics procedure. Be sure to re-run that procedure if you adjust the storm information in the Storms table.
The resulting graphic files may be easily imported to Powerpoint for presentation using the ImageImport macro in the ImageImport.ppt file included in the NetSTORM installation folder.
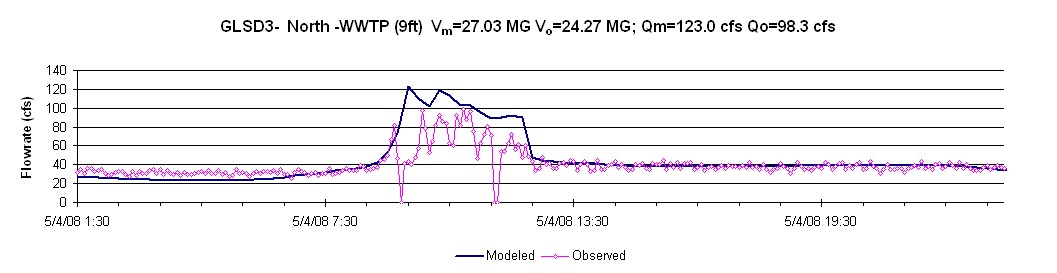
SWMM Plotter operates in US units. Model data are expected as CFS. Flows are reported as CFS and volumes as MG.
Dry periods may be specified and plotted for use in dry weather flow calibration. If the DryPeriod box is checked, the 'event' is excluded from gage statistics calculations [FEATURE REMOVED 9/08]
Example plot where gage data exists:
Example plot where no gage data present: